중소기업을 위한 정보
당신의 사업에는 일정한 패턴이 있습니다. 하지만 대부분의 사업주는 그 패턴을 알아차리지 못합니다.
A good week and a bad week feel the same in the moment — you just keep working. Without a record, you can't tell the difference between normal ups and downs and something actually going wrong, until it's already a problem. MetriqOne's whole purpose is showing you that difference early enough to do something about it.
That is the main thing it does: read your own numbers back to you in a way that catches drift while it's still small, so you can find the real cause and fix it — before a bad month becomes a bad year. A printed, dated record of how your business performs comes along with that, almost as a side effect — and it happens to be exactly what a bank or a buyer wants to see. Here is what actually happens, week by week.

세 개의 사업. 모두 같은 출발점에서 시작했습니다.
업무는 다르지만 격차는 똑같습니다. 정상적인 변동과 실제 위험 신호를 구분할 방법이 없고, 은행이나 구매자가 신뢰할 만한 문서도 없습니다. 우리는 실제로 어떤 일이 벌어지는지 세 가지 사례 모두를 추적해 볼 것입니다.

거래자
시장이나 국경을 넘어 물건을 사고파다. 매주 거래를 한다. 서류상으로는 그런 내용이 없다.

농부
정해진 주기로 농산물을 재배하고 판매합니다. 수확량은 변동이 심하며, "정상" 수확량이 어느 정도인지에 대한 기록조차 없습니다.

워크숍
주문 제작 또는 수리 서비스를 제공하며, 믿을 수 있는 배송 서비스를 제공합니다. 지금까지는 누구에게도 이를 증명할 필요가 없었지만, 이제는 다릅니다.
실제로 일어나는 일 — 주별
회원 가입 후, "벌금"의 의미를 직접 결정하세요.
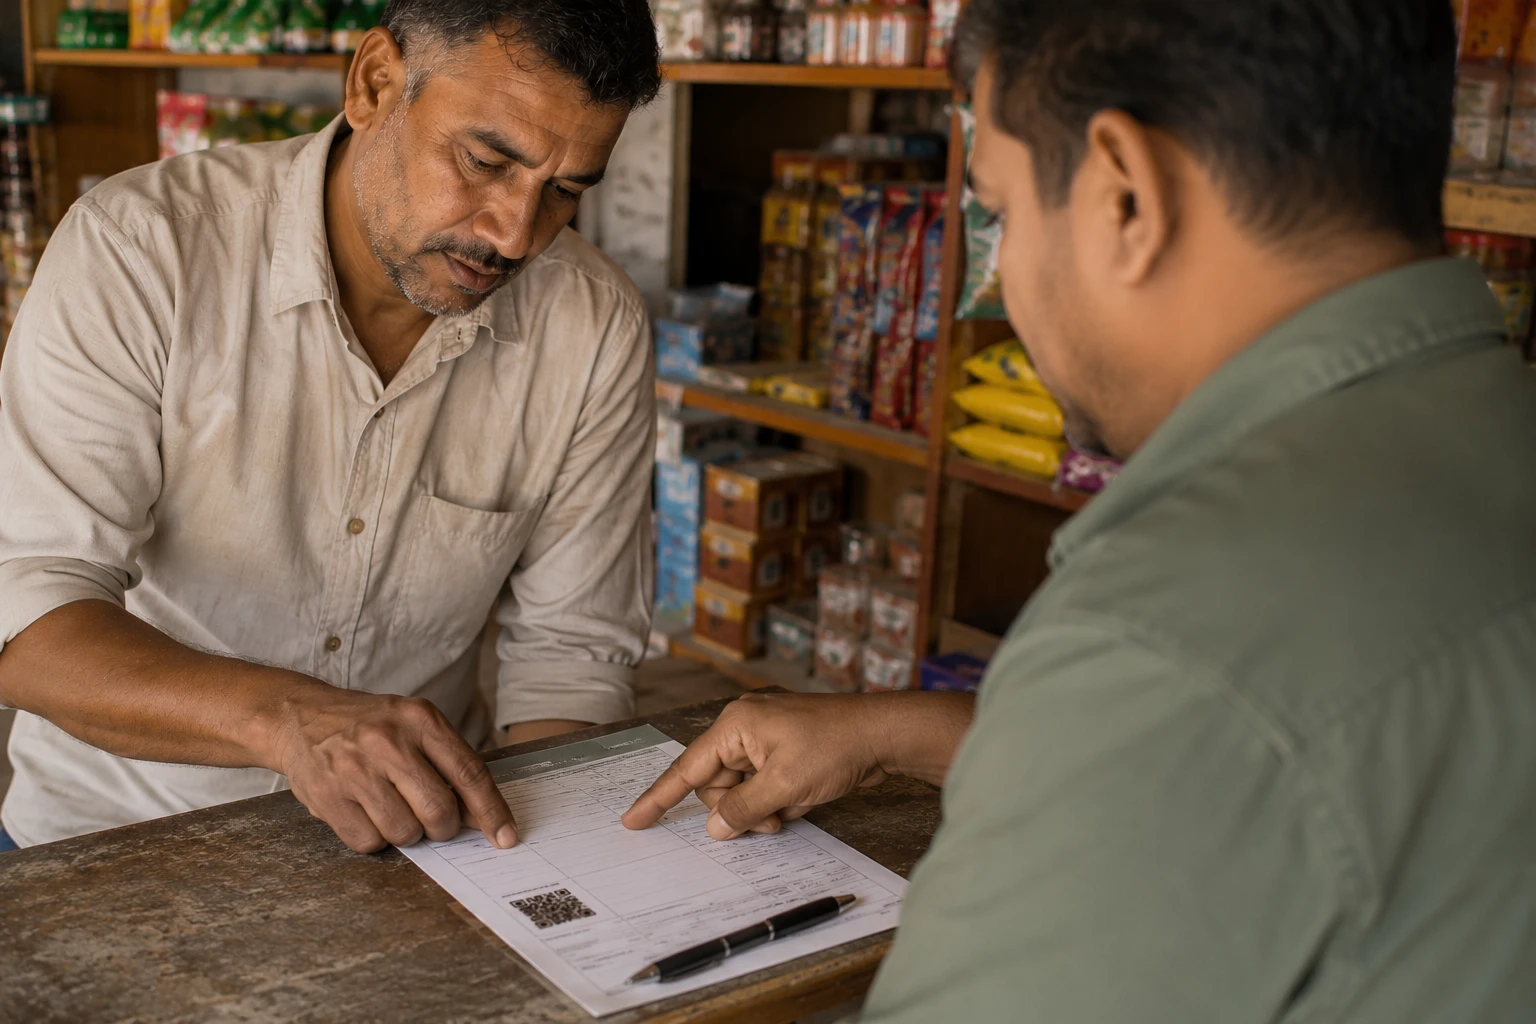
You register once, either yourself with a smartphone, or through a local print shop or cooperative office that does it for you on paper — this is called a Node-Business, and it exists specifically for people without a smartphone or reliable internet. Either way, you become a Member Operator on your own account, called a Field account: it belongs to you, not to anyone above you.
You answer a few honest questions about your business — what it actually is, what's working against it right now, what "doing fine" looks like in your own terms. You also set one number — a threshold you choose — below which you want to know something's wrong. This is called your CPL. No one sets it for you. You know your business; the number is yours.
이미 하고 있는 일을 제출하세요
Once a week — or however often makes sense for your business — you record a few real numbers from your own work. On the app if you have one. On paper, submitted through your Node-Business, if you don't. No new work. Just writing down what you already know.
당신은 처음으로 당신 자신의 패턴을 보게 됩니다
After a few weeks of readings, enough data exists to calculate your natural range — called XmR — the pattern your own numbers actually follow, worked out from your own history, not a guess. This is the moment the framework starts doing its real job: telling the difference between a normal bad week and a genuine warning sign.
From this point on, you have two things watching for you at once: the threshold you chose on Day 1, and the pattern your own business just revealed about itself. And because the readings are already there, you can also print a proof report right now — a record showing consistent, in-limit performance, ready the moment a bank or a buyer asks for it.
이는 예시일 뿐이며, 실제 주간 운세와 한계선은 본인의 과거 데이터를 기반으로 계산해야 합니다.
이것이 바로 실력 향상에 실제로 도움이 되는 부분입니다.
Here is what that looks like in practice. Take the Farmer from earlier. For months, weekly yield readings sit comfortably inside the natural range XmR calculated back in Month 1 — some weeks a little higher, some lower, all normal variation. Then, over three weeks, readings start drifting down. Not dramatically. Not yet below the CPL threshold. But the shape doesn't look like the usual up-and-down anymore — it looks like a trend.
That shape is the whole point. A single bad week means nothing on its own. A trend means something changed. Instead of finding out three months later when the season's income is visibly down, the Farmer sees it in week three and asks the right question early: what changed around here? Looking back, the irrigation schedule shifted after a pump was replaced two weeks before the drift started. Not a guess — a specific, dated, checkable cause, found because the timing lined up with the farmer's own readings, not with memory.
The irrigation timing gets adjusted back. The next few weeks' readings are the test: if the cause was right, yield recovers into the normal range again. It does. That recovery is confirmed by the exact same signal that caught the problem — not a hope that the fix worked, a checked one.
That loop — catch it early, find the real cause, fix it, confirm the fix worked — is what MetriqOne is actually for. The record this builds along the way never disappears either: nothing is deleted or overwritten, and if you pause for a season, everything is waiting exactly as you left it. A year from now, that record also happens to be exactly what a bank or a buyer wants to see. But that was never the main event — getting better at what you do, one caught problem at a time, is.
당신이 실제로 달성하는 것
문제가 아직 작을 때 발견할 수 있습니다.
자신의 한계점과 자연적인 범위가 동시에 작용하는 상황, 즉 갑작스러운 변화가 아닌 몇 주 전부터 경고를 받는 상황, 마치 농부가 수확량 변동을 미리 파악한 것과 같습니다.
추측이 아닌 진짜 원인을 찾아내는군요.
신호는 상황이 변한 시점을 알려줍니다. 그 신호를 당시 실제로 일어난 일과 비교해 보면 "뭔가 잘못됐다"는 것을 구체적이고 해결 가능한 원인으로 바꿀 수 있습니다.
은행은 약속이 아니라 실적을 봅니다.
대출 신청 시에는 본인이 작성한 소득 명세서가 아닌, 일관되고 한도 내에서의 상환 실적을 보여주는 인쇄된 서류를 제출해야 합니다.
구매자는 영업 설명이 아니라 증거를 봅니다.
귀사가 자체 조건에 따라 안정적으로 납품한다는 증거가 뒷받침되는 공급 계약 또는 정기 주문서.
당신은 그 모든 것을 소유할 권리가 있습니다.
본사에서는 사용자가 직접 공유를 선택하지 않는 한 사용자의 데이터를 읽지 않습니다. 사용자의 계정, 신호, 인쇄된 증거 자료 모두 안전하게 보관됩니다.
스마트폰이 없어도 괜찮아요.
Node-Business — 여러분이 이미 알고 있는 쇼핑몰
An existing print shop, cooperative office, or market desk — somewhere you already trust — registers you, prints your forms, submits them for you, and prints your proof report whenever you need it. Paper in, proof out. No app, no data plan, no new habit to learn.
노드 비즈니스는 어떻게 운영되나요? →당신은 이미 일을 하고 있습니다. 이제 패턴을 파악해 보세요.
Nothing about your business needs to change. What changes is whether you can catch the moment something drifts, understand why, and fix it — before it costs you a season. Proof for a bank or a buyer comes along with that, but it was never the point. Getting better at what you already do is. That starts with a Day 1.
시작하기