中小企業向け
あなたのビジネスには一定のパターンが存在する。しかし、ほとんどの経営者はそれに気づかない。
A good week and a bad week feel the same in the moment — you just keep working. Without a record, you can't tell the difference between normal ups and downs and something actually going wrong, until it's already a problem. MetriqOne's whole purpose is showing you that difference early enough to do something about it.
That is the main thing it does: read your own numbers back to you in a way that catches drift while it's still small, so you can find the real cause and fix it — before a bad month becomes a bad year. A printed, dated record of how your business performs comes along with that, almost as a side effect — and it happens to be exactly what a bank or a buyer wants to see. Here is what actually happens, week by week.

3つの事業。出発点は同じ。
作業内容は異なれど、ギャップは同じ:通常の変動と真の警告サインを見分ける方法はなく、銀行や買い手が信頼できるような文書も存在しない。実際に何が起こるのか、この3つの事例を詳しく見ていこう。

トレーダー
市場や国境を越えて商品を売買する。毎週取引を行っている。書類上は何も記載されていない。

農夫
一定のサイクルで農産物を栽培・販売する。収穫量は変動する。「通常」の収穫量がどのようなものか、記録すら残っていない。

ワークショップ
注文に応じて製品を製造または修理する。納期も確実。これまで誰にもそれを証明する必要はなかった――今までは。
実際に何が起こるのか ― 週ごとの推移
登録すれば、罰金の意味は自分で決められる。
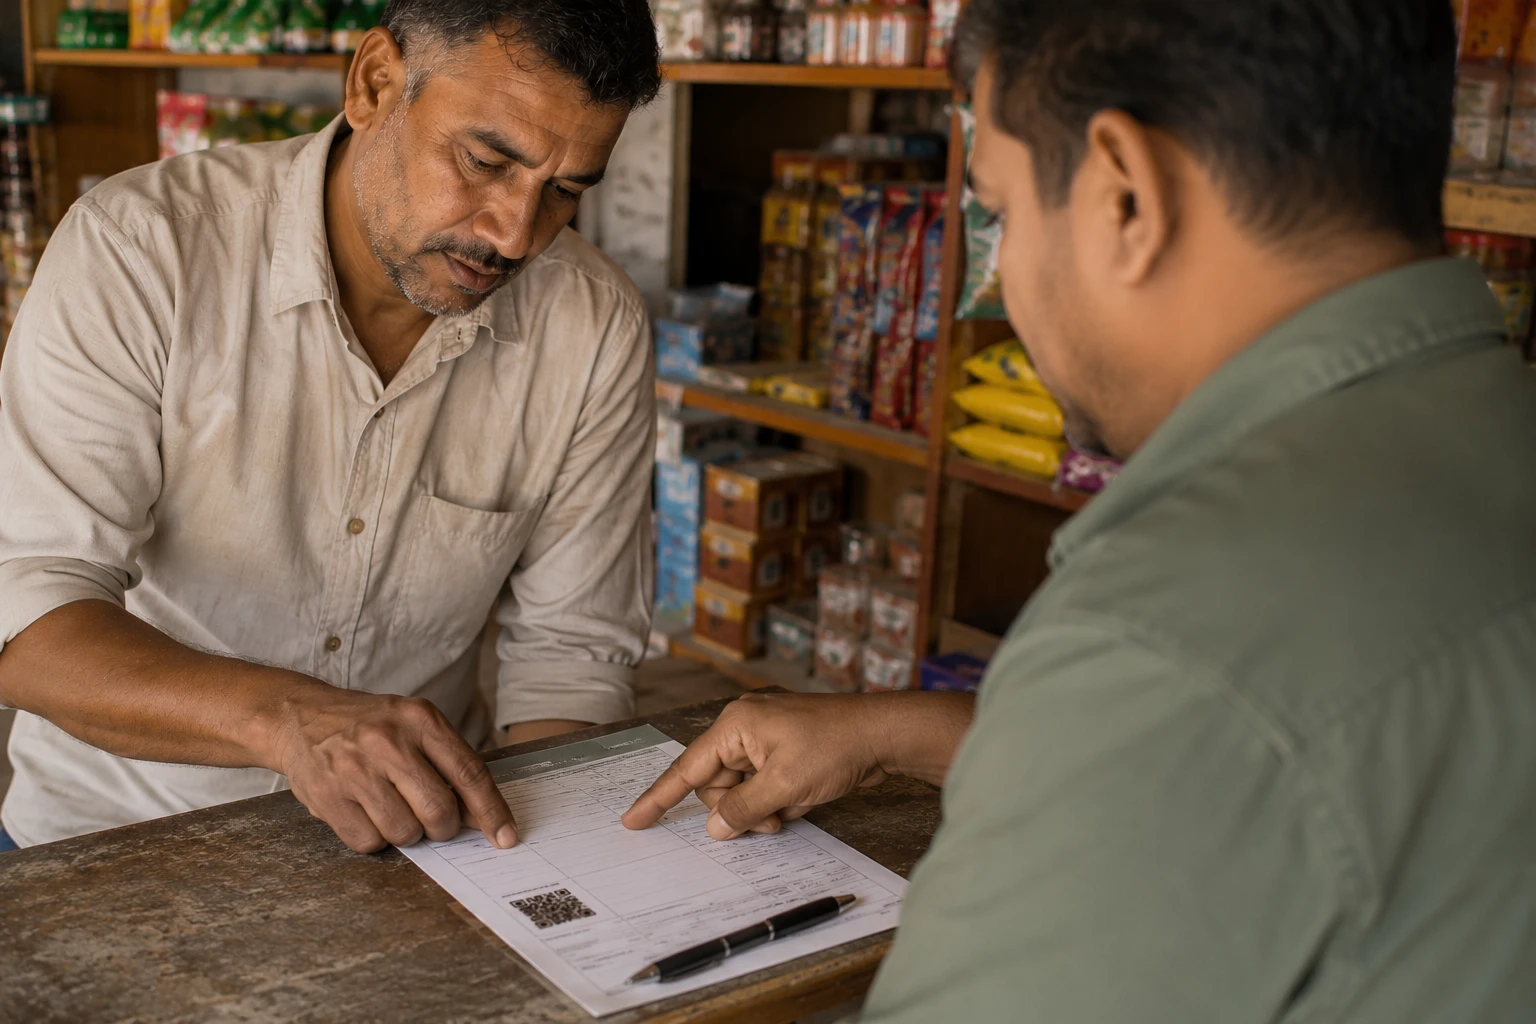
You register once, either yourself with a smartphone, or through a local print shop or cooperative office that does it for you on paper — this is called a Node-Business, and it exists specifically for people without a smartphone or reliable internet. Either way, you become a Member Operator on your own account, called a Field account: it belongs to you, not to anyone above you.
You answer a few honest questions about your business — what it actually is, what's working against it right now, what "doing fine" looks like in your own terms. You also set one number — a threshold you choose — below which you want to know something's wrong. This is called your CPL. No one sets it for you. You know your business; the number is yours.
あなたが既に行っていることを提出してください
Once a week — or however often makes sense for your business — you record a few real numbers from your own work. On the app if you have one. On paper, submitted through your Node-Business, if you don't. No new work. Just writing down what you already know.
初めて自分のパターンに気づく

After a few weeks of readings, enough data exists to calculate your natural range — called XmR — the pattern your own numbers actually follow, worked out from your own history, not a guess. This is the moment the framework starts doing its real job: telling the difference between a normal bad week and a genuine warning sign.
From this point on, you have two things watching for you at once: the threshold you chose on Day 1, and the pattern your own business just revealed about itself. And because the readings are already there, you can also print a proof report right now — a record showing consistent, in-limit performance, ready the moment a bank or a buyer asks for it.
これはあくまで例示です。あなた自身の週ごとの読書量、あなた自身の制限ラインは、あなた自身の履歴に基づいて計算されます。
これが実際にあなたの回復に役立つ部分です
Here is what that looks like in practice. Take the Farmer from earlier. For months, weekly yield readings sit comfortably inside the natural range XmR calculated back in Month 1 — some weeks a little higher, some lower, all normal variation. Then, over three weeks, readings start drifting down. Not dramatically. Not yet below the CPL threshold. But the shape doesn't look like the usual up-and-down anymore — it looks like a trend.
That shape is the whole point. A single bad week means nothing on its own. A trend means something changed. Instead of finding out three months later when the season's income is visibly down, the Farmer sees it in week three and asks the right question early: what changed around here? Looking back, the irrigation schedule shifted after a pump was replaced two weeks before the drift started. Not a guess — a specific, dated, checkable cause, found because the timing lined up with the farmer's own readings, not with memory.
The irrigation timing gets adjusted back. The next few weeks' readings are the test: if the cause was right, yield recovers into the normal range again. It does. That recovery is confirmed by the exact same signal that caught the problem — not a hope that the fix worked, a checked one.
That loop — catch it early, find the real cause, fix it, confirm the fix worked — is what MetriqOne is actually for. The record this builds along the way never disappears either: nothing is deleted or overwritten, and if you pause for a season, everything is waiting exactly as you left it. A year from now, that record also happens to be exactly what a bank or a buyer wants to see. But that was never the main event — getting better at what you do, one caught problem at a time, is.
実際に達成できること
問題がまだ小さいうちに発見する
あなた自身の限界値と、あなた自身の自然な範囲の両方が同時に監視している――農家が収穫量の変動を先読みしたように、驚きではなく数週間の警告が与えられる。
推測ではなく、真の原因を見つける
変化の兆候は、いつ状況が変わったかを示している。その兆候を、その時期に実際に何が起こったかと照らし合わせることで、「何かがおかしい」という感覚が、具体的で解決可能な原因へと変わる。
銀行は約束ではなく、実績を見る。
融資申請書には、一貫して限度額内での返済実績を示す印刷された履歴を添付する必要があります。自己作成の損益計算書は不要です。
買い手は売り込みではなく、証拠を見る。
貴社が自社の条件で確実に納品できるという証拠に裏付けられた供給契約または定期発注書。
あなたはそれを全て所有している
あなたが共有することを選択しない限り、本社があなたのデータを閲覧することはありません。あなたのアカウント、あなたのシグナル、印刷された証拠。
スマートフォンがなくても大丈夫。
Node-Business ― あなたが既に知っているお店
An existing print shop, cooperative office, or market desk — somewhere you already trust — registers you, prints your forms, submits them for you, and prints your proof report whenever you need it. Paper in, proof out. No app, no data plan, no new habit to learn.
ノードビジネスの仕組み →あなたは既にその作業を行っています。パターンが見えてくるはずです。
Nothing about your business needs to change. What changes is whether you can catch the moment something drifts, understand why, and fix it — before it costs you a season. Proof for a bank or a buyer comes along with that, but it was never the point. Getting better at what you already do is. That starts with a Day 1.
さあ始めましょう